The Sea Ice Extent Archive
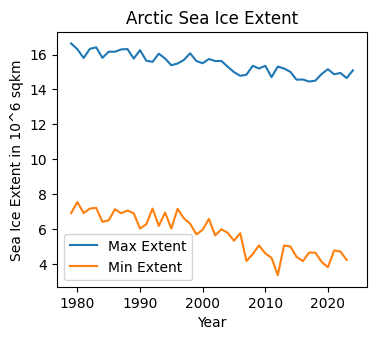
Displays Sea Ice Extent in tables for the Arctic and Antarctic from 1979 to date
My thanks go to the folks at Kaggle for the csv files
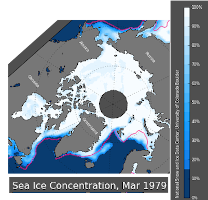
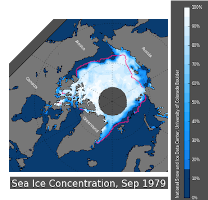
with the Sea Ice Extent data and the folks at National Snow and Ice data Center
for the images of 1979.
I update my images on the 1st April and 1st October each year.
Click for the Arctic and Antarctic Tables
Below the Chart are images comparing the Max and Min
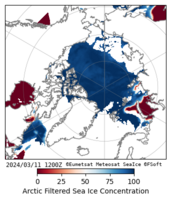
Sea Ice Concentration for the Arctic in 1979 and 2020. Unfortunately my backup of data from 2005 to 2017 has been
corrupted on a DVD, so I have downloaded the earliest Arctic data I could get
from the National Snow and Ice data Center.
Arctic Max/Min Data
Arctic Maximum Extent for 1979 and Latest


Arctic Minimum Extent for 1979 and Latest
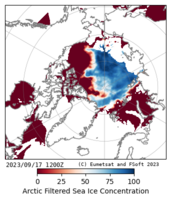


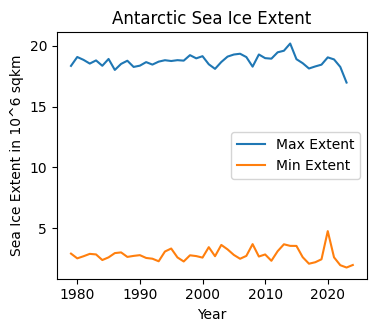
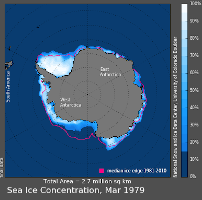
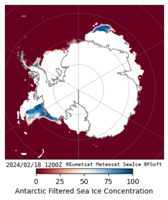
Antarctic Max/Min Data
Antarctic Maximum Extent for 2010 and Latest
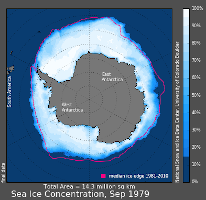
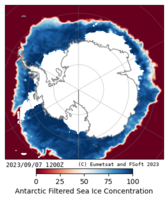


Antarctic Minimum Extent for 2010 and Latest


Arctic Max/Min Sea Ice Extent Table
| Year | Max | Max Date | Min | Min Date |
|---|---|---|---|---|
| 1979 | 16.635 | 1979-03-01 | 6.895 | 1979-09-21 |
| 1980 | 16.302 | 1980-03-05 | 7.533 | 1980-09-05 |
| 1981 | 15.801 | 1981-03-14 | 6.902 | 1981-09-10 |
| 1982 | 16.325 | 1982-02-27 | 7.16 | 1982-09-13 |
| 1983 | 16.412 | 1983-03-14 | 7.204 | 1983-09-08 |
| 1984 | 15.809 | 1984-03-18 | 6.396 | 1984-09-16 |
| 1985 | 16.163 | 1985-03-17 | 6.486 | 1985-09-09 |
| 1986 | 16.158 | 1986-03-10 | 7.122 | 1986-09-06 |
| 1987 | 16.293 | 1987-02-21 | 6.89 | 1987-09-02 |
| 1988 | 16.309 | 1988-03-10 | 7.048 | 1988-09-11 |
| 1989 | 15.766 | 1989-03-06 | 6.888 | 1989-09-22 |
| 1990 | 16.249 | 1990-03-12 | 6.011 | 1990-09-21 |
| 1991 | 15.647 | 1991-02-25 | 6.259 | 1991-09-16 |
| 1992 | 15.576 | 1992-03-12 | 7.159 | 1992-09-07 |
| 1993 | 16.048 | 1993-03-13 | 6.161 | 1993-09-13 |
| 1994 | 15.77 | 1994-02-21 | 6.934 | 1994-09-05 |
| 1995 | 15.384 | 1995-03-31 | 6.012 | 1995-09-04 |
| 1996 | 15.484 | 1996-02-21 | 7.147 | 1996-09-10 |
| 1997 | 15.684 | 1997-03-20 | 6.602 | 1997-09-03 |
| 1998 | 16.07 | 1998-02-25 | 6.293 | 1998-09-17 |
| 1999 | 15.627 | 1999-03-30 | 5.676 | 1999-09-12 |
| 2000 | 15.498 | 2000-03-03 | 5.943 | 2000-09-11 |
| 2001 | 15.742 | 2001-03-04 | 6.567 | 2001-09-19 |
| 2002 | 15.624 | 2002-03-09 | 5.625 | 2002-09-18 |
| 2003 | 15.629 | 2003-03-20 | 5.969 | 2003-09-17 |
| 2004 | 15.3 | 2004-03-10 | 5.77 | 2004-09-18 |
| 2005 | 14.993 | 2005-03-09 | 5.314 | 2005-09-20 |
| 2006 | 14.777 | 2006-03-11 | 5.746 | 2006-09-14 |
| 2007 | 14.842 | 2007-03-10 | 4.147 | 2007-09-14 |
| 2008 | 15.354 | 2008-02-27 | 4.548 | 2008-09-18 |
| 2009 | 15.195 | 2009-03-02 | 5.047 | 2009-09-12 |
| 2010 | 15.351 | 2010-03-31 | 4.59 | 2010-09-19 |
| 2011 | 14.704 | 2011-03-07 | 4.333 | 2011-09-08 |
| 2012 | 15.307 | 2012-03-18 | 3.34 | 2012-09-16 |
| 2013 | 15.196 | 2013-03-14 | 5.04 | 2013-09-13 |
| 2014 | 15.007 | 2014-03-20 | 4.988 | 2014-09-16 |
| 2015 | 14.554 | 2015-02-22 | 4.387 | 2015-09-08 |
| 2016 | 14.566 | 2016-03-22 | 4.145 | 2016-09-07 |
| 2017 | 14.449 | 2017-03-05 | 4.635 | 2017-09-13 |
| 2018 | 14.499 | 2018-03-14 | 4.63 | 2018-09-21 |
| 2019 | 14.883 | 2019-03-11 | 4.1 | 2019-09-17 |
| 2020 | 15.155 | 2020-03-04 | 3.793 | 2020-09-13 |
| 2021 | 14.866 | 2021-03-11 | 4.757 | 2021-09-14 |
| 2022 | 14.94 | 2022-02-21 | 4.692 | 2022-09-15 |
| 2023 | 14.646 | 2023-03-05 | 4.213 | 2023-09-17 |
| 2024 | 15.094 | 2024-03-11 |
Antactic Max/Min Sea Ice Extent Table
| Year | Max | Max Date | Min | Min Date |
|---|---|---|---|---|
| 1979 | 18.361 | 1979-09-13 | 2.911 | 1979-02-17 |
| 1980 | 19.092 | 1980-09-23 | 2.521 | 1980-02-26 |
| 1981 | 18.856 | 1981-09-18 | 2.694 | 1981-02-20 |
| 1982 | 18.55 | 1982-09-03 | 2.89 | 1982-02-23 |
| 1983 | 18.811 | 1983-09-20 | 2.843 | 1983-02-24 |
| 1984 | 18.37 | 1984-09-22 | 2.382 | 1984-02-27 |
| 1985 | 18.931 | 1985-09-11 | 2.602 | 1985-02-19 |
| 1986 | 18.027 | 1986-09-18 | 2.953 | 1986-03-06 |
| 1987 | 18.524 | 1987-09-15 | 3.01 | 1987-02-21 |
| 1988 | 18.785 | 1988-10-03 | 2.639 | 1988-02-24 |
| 1989 | 18.274 | 1989-09-23 | 2.723 | 1989-02-20 |
| 1990 | 18.379 | 1990-09-30 | 2.784 | 1990-02-22 |
| 1991 | 18.671 | 1991-09-30 | 2.554 | 1991-02-27 |
| 1992 | 18.467 | 1992-09-11 | 2.492 | 1992-02-23 |
| 1993 | 18.71 | 1993-09-20 | 2.281 | 1993-02-19 |
| 1994 | 18.827 | 1994-08-31 | 3.083 | 1994-02-12 |
| 1995 | 18.762 | 1995-09-26 | 3.33 | 1995-02-24 |
| 1996 | 18.831 | 1996-09-23 | 2.597 | 1996-02-25 |
| 1997 | 18.792 | 1997-09-22 | 2.264 | 1997-02-27 |
| 1998 | 19.244 | 1998-09-15 | 2.772 | 1998-02-25 |
| 1999 | 18.981 | 1999-09-30 | 2.707 | 1999-02-20 |
| 2000 | 19.159 | 2000-09-28 | 2.582 | 2000-02-18 |
| 2001 | 18.494 | 2001-09-28 | 3.441 | 2001-02-19 |
| 2002 | 18.116 | 2002-09-09 | 2.697 | 2002-02-20 |
| 2003 | 18.68 | 2003-09-25 | 3.626 | 2003-02-17 |
| 2004 | 19.124 | 2004-09-08 | 3.259 | 2004-02-20 |
| 2005 | 19.295 | 2005-09-29 | 2.804 | 2005-02-18 |
| 2006 | 19.36 | 2006-09-21 | 2.487 | 2006-02-20 |
| 2007 | 19.086 | 2007-09-29 | 2.723 | 2007-02-19 |
| 2008 | 18.298 | 2008-09-03 | 3.692 | 2008-02-20 |
| 2009 | 19.299 | 2009-09-24 | 2.671 | 2009-02-22 |
| 2010 | 18.998 | 2010-09-06 | 2.842 | 2010-02-16 |
| 2011 | 18.954 | 2011-09-23 | 2.319 | 2011-02-22 |
| 2012 | 19.478 | 2012-09-22 | 3.111 | 2012-02-23 |
| 2013 | 19.608 | 2013-10-01 | 3.679 | 2013-02-19 |
| 2014 | 20.201 | 2014-09-20 | 3.548 | 2014-02-21 |
| 2015 | 18.912 | 2015-10-02 | 3.544 | 2015-02-18 |
| 2016 | 18.581 | 2016-08-29 | 2.616 | 2016-02-17 |
| 2017 | 18.145 | 2017-10-09 | 2.08 | 2017-03-01 |
| 2018 | 18.315 | 2018-09-30 | 2.2 | 2018-02-19 |
| 2019 | 18.462 | 2019-09-30 | 2.444 | 2019-02-28 |
| 2020 | 19.062 | 2020-09-25 | 4.762 | 2020-01-12 |
| 2021 | 18.893 | 2021-08-30 | 2.604 | 2021-02-19 |
| 2022 | 18.276 | 2022-09-13 | 1.957 | 2022-02-25 |
| 2023 | 16.988 | 2023-09-07 | 1.766 | 2023-02-19 |
| 2024 | 1.974 | 2024-02-18 |