I have a Grove Gas Sensor in action since July 2017. I recently noticed there seemed to be a diurnal variation in the Methane Levels which was very noticeable compared with the pretty steady levels of all the other pollutants.
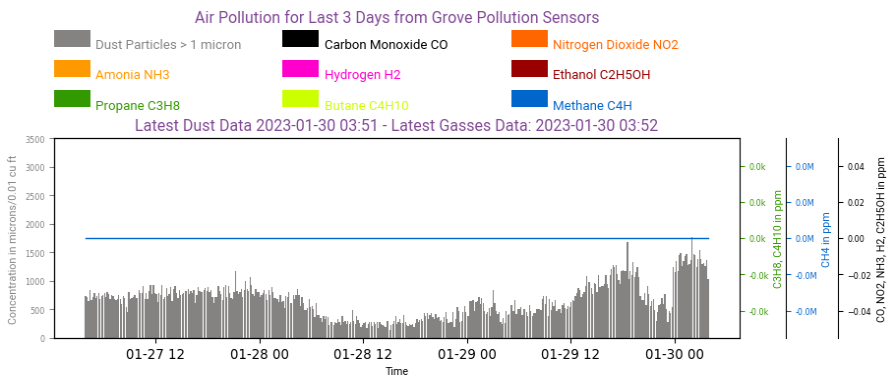
Here is the current three day graph of the Pollutants:
As a result of this I started looking at the Methane Data in more detail. There is a considerable difference in Methane levels between Winter Months and Summer Months, the levels being a good deal higher in the Summer. I think this is due to the cattle being in the fields in the Summer and being in a barn in the Winter.
I have produced graphs of Hourly Methane Levels by the month and also looked at the Methane Levels against Wind Direction by the month.
The results can be found in My Methane Stats. You can choose to view any Month of the Year which will show that month for the years I have had the sensor working. Similarly you can view the data by Year which will show all the months I have data for that year.