Here is the Sea Ice Concentration for the Arctic and Antarctic.
For the latest on Sea Ice Edge Data from 1979 to date go here
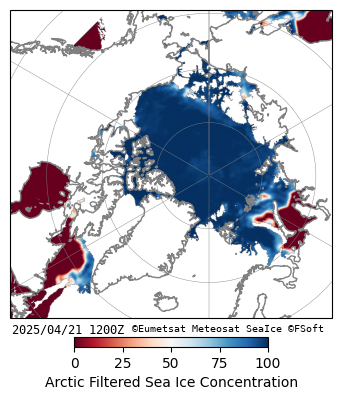
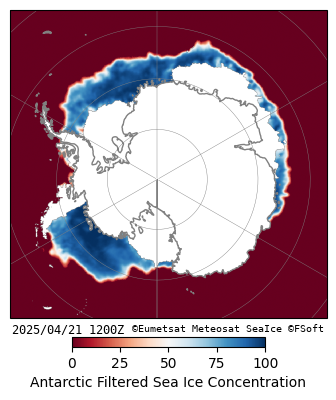
These images are always 24 hours old so the latest image is from yesterday
The Background
I have been interested in Polar Exploration from childhood, so when I have the opportunity to receive Sea Ice Data via Eumetcast I got involved. For some years, once a day, the images of Sea Ice Type, Edge and Concentration were transmitted in Grib Format. In early 2018 this format was dropped and netCDF became the preferred file type.
I used Python 2.7 and pygrib to decode the original images for some years, but my backup DVD for data before 2017 is corrupt, so I do not have those images now. Here is an example of the Arctic and Antarctic Images I used at that time. I was able to create Animations of both poles usually 60 days worth at one image per day, making the shrinking and growing of the ice easy to visualise.
At Last!! and this is early 2020 I have got round to moving to Python 3.7 and trying to decode the netCDF Sea Ice Files. Thanks to the Scientists at OSI - SAF helping me with the code to be able to visualise these images I now can go back to creating a daily image and 60 day Animations. The main Python Modules I am using are netcdf4, matplotlib, and cartopy which is great as you can see below in images also from the 1st January, but 3 years later.