The effects of an Eclipse on the weather are documented all over the place. I noticed that the BBC were promoting a project to record various aspects of the weather during the Partial Eclipse of 20th March 2015 organised by the Department of Meteorology at the University of Reading. However I could not contribute because a post code was required to register and there are no post codes in the depths of West Cork, Ireland where I live (see satellite Image 0815).
I enjoyed excellent views of the 1999 Total Eclipse on St. Marys, Isles of Scilly, so was very excited to be able to experience this one at home, even though it would be only a Partial Eclipse (referred to as Eclipse from here on). The forecast looked promising too.
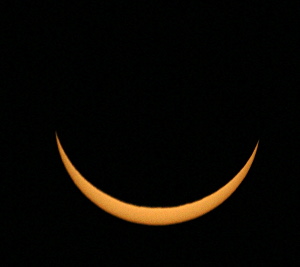
We were due to have 92% of the sun covered at 09:22:34 UTC which I expected would have noticeable effects on the weather. I was able to observe the Eclipse in various ways, using special eclipse glasses, a colander, a pin hole camera, and my Digital SLR with a 500mm lens and Solar Filter. Fortunately the cloud cleared during the first part of the Eclipse, then we had a pretty clear sky for most of the Eclipse itself. Being stuck out on the Mizen Peninsula we tend to get significantly less cloud than inland sites. In the photograph I took at maximum coverage you can see the irregular edge of the moon quite clearly.
The expected effects on the weather are as follows:
- A fall in Solar Radiation.
- A fall in Temperature of about 1°C or 2°C caused by a reduction in the radiation from the sun.
- A fall in Wind Speed.
- A reduction in the variability of Wind Direction due to the stabilisation of the boundary layer and associated reduction in turbulence (Reading University). The Wind Direction has also been found to 'back' (go anticlockwise) due to an 'Eclipse Cyclone'.
I have an excellent Automatic Weather Station (AWS) (well three actually), but my old Instromet system is slowly dying. My Davis Vantage Pro works well most of the time. I have used the data from my fancy Campbell Scientific AWS recording data every 5 minutes3 to examine the data for the Eclipse. In particular the Ultrasonic Wind sensor at a height of 6 metres is very sensitive and accurate especially at low wind speeds. The site is very exposed on the northern side of the Mizen Peninsula, 2.8km from the sea at a height of 60 metres above sea level. We look out down Dunmannus Bay into the Atlantic. The anemometers are on a 10m mast well away from the house. The AWS is away from the house nearby, and well exposed.
The Eclipse started at 08:19:06 UTC and finished at 10:30:23 UTC, with an eery darkness, and the birds going quiet, as we expected, during the time of maximum coverage.
I have included the False Colour Images of the British Isles from Eumetcast at 0815, 0915, and 1015 UTC which show my location, cloud cover and the darkness of the Eclipse at 0915 UTC rather well.
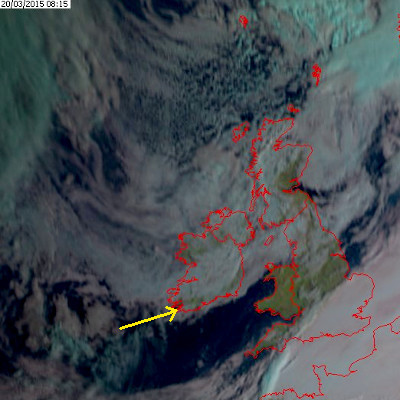
False Colour Eumetcast Image British Isles taken at 0815 UTC with the yellow arrow pointing to my location.
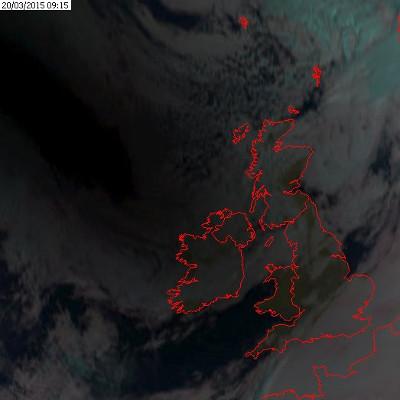
False Colour Eumetcast Image British Isles taken at 0915 UTC showing the darkness of the Eclipse to the North West
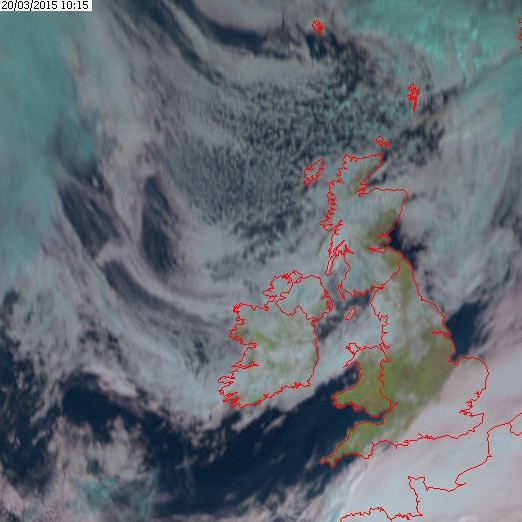
False Colour Eumetcast Image British Isles taken at 1015 UTC
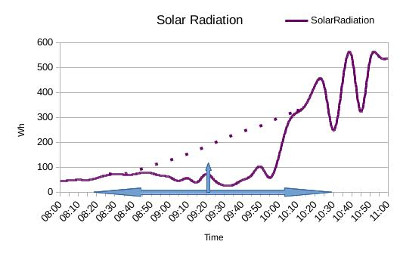
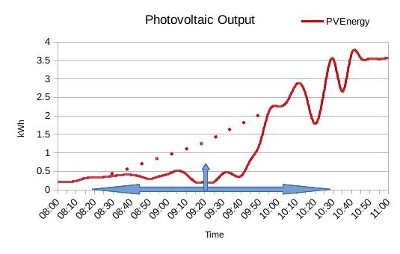
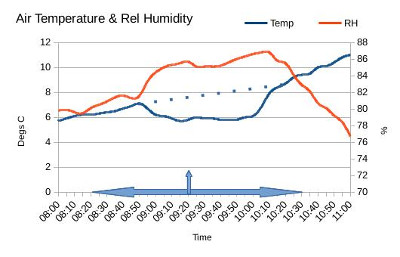
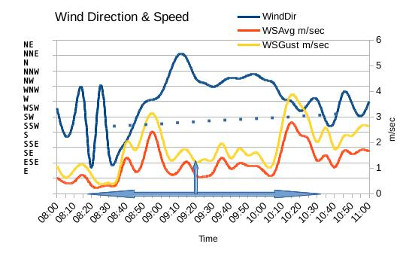
I have provided graphs showing the effect of the Partial Eclipse on Solar Radiation, Air Temperature and Relative Humidity (RH), Wind Speed and Direction. Each of the graphs has a blue horizontal arrow to show the period of the Eclipse and a vertical arrow at the maximum point.
The Solar Radiation was a little low to start with because of a little altocumulus cloud, however it can be seen that it falls, as does the output from my Photovoltaic Panels.
This is what I observed:
- The Solar Radiation was kept down somewhat early in the eclipse by the cloud cover, remaining down during the Eclipse period, rising rapidly at the end. The dotted line shows the expected rise in clear weather.
- The Air Temperature (blue line), which should have been rising steadily, fell by 1°C then remained pretty static eventually lagging behind the expected rise by about 2°C and then catching up very quickly once the Eclipse was over. The dotted line shows the expected rise in Temperature.
- The Relative Humidity rose quite sharply as the Temperature fell, then fell back as the Temperature rose once again.
- The Wind Speed Average (red line) and Gust Speed (yellow line) rose early in the Eclipse and towards the end from about 0.4-1 m/sec to 2-3 m/sec falling back by about 1.5 m/sec in the middle.
- The Wind Direction (blue line) very clearly shows a reduction in variability. The general trend is represented by the dotted line. The general direction however 'veered' (moved clockwise) from SSW to NW then back to SW.
Conclusion
The effects that I observed from my Automatic Weather Station on the weather by this Partial Eclipse are pretty much as expected. The Solar Radiation fell, the Air Temperature fell, and the Wind Speed fell. However, some of the changes in Wind Direction were not what I expected. There was a reduction in the variability of the wind direction, but Instead of backing the wind veered quite markedly.
I think I am correct in saying, if there was an Eclipse Cyclonic effect (wind in an anticlockwise direction round an Eclipse), and we were on the East side of that 'Eclipse Cyclone', then you would expect the wind to veer, which is what happened here in Sunny West Cork.
The rise in RH is to be expected because as Temperature falls, the ability of the air to hold moisture will also fall, so the RH will rise. Once the Eclipse was over, the Air Temperature rose once again, causing the RH to fall.
Being able to look at these data enhanced my Eclipse Experience, and should I be able to enjoy another one, then I will be trying to take weather observations as well as enjoy all the other sensations of this natural wonder.
References
1. http://www.met.reading.ac.uk/outreach/newex_2015/index.html
2. http://blogs.reading.ac.uk/weather-and-climate-at-reading/2015/how-do-solar-eclipses-affect-the-weather/
3. The Data as a CSV file