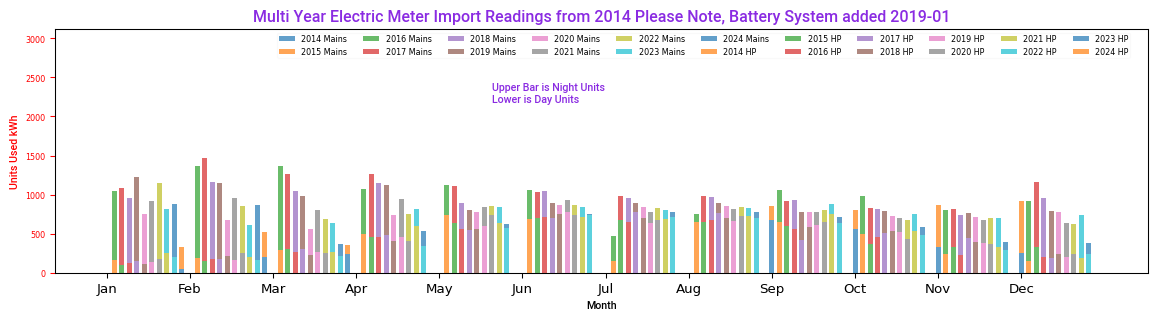
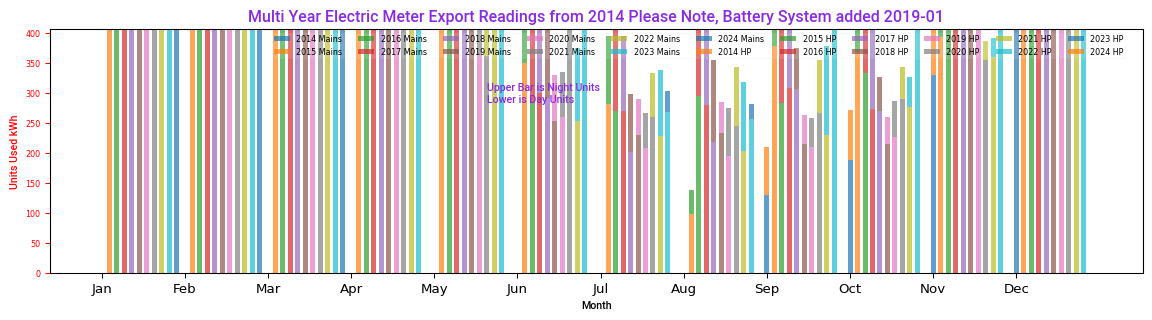
These images show how much Electricity we have been using and creating since we installed out Solar Photovoltaic Panels in 2014. The Red is Electricity used by the Geothermal Heat Pump. The Blue is the rest of our Electricity Use. Green is Electricity generated by the Solar Panels offsetting the Electricity we are using. The Yellow is the Electricity being Exported to the Grid.
For the full picture visit the PV Stats Page
In 2018 we were generating 22.5% of our yearly Electricity Used, and Export an equivalent 13.5%. Time for Batteries I think!
So in January 2019 I added a 10kWh battery which has performed well.
Now we generate about 37% of our electricity used in a year.


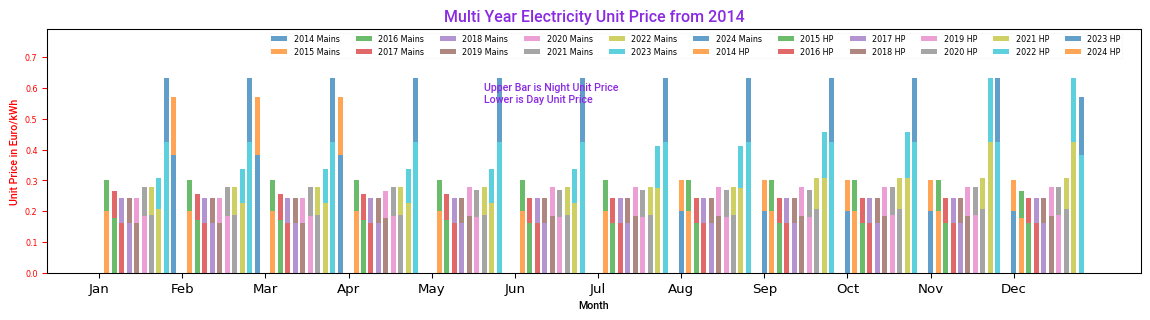
And here we have in late 2022 with an energy crisis a graph of Electricity Unit Prices since 2014